Logary Rutta
Usage1
Route, forward and print logs anywhere to anything.

Usage2
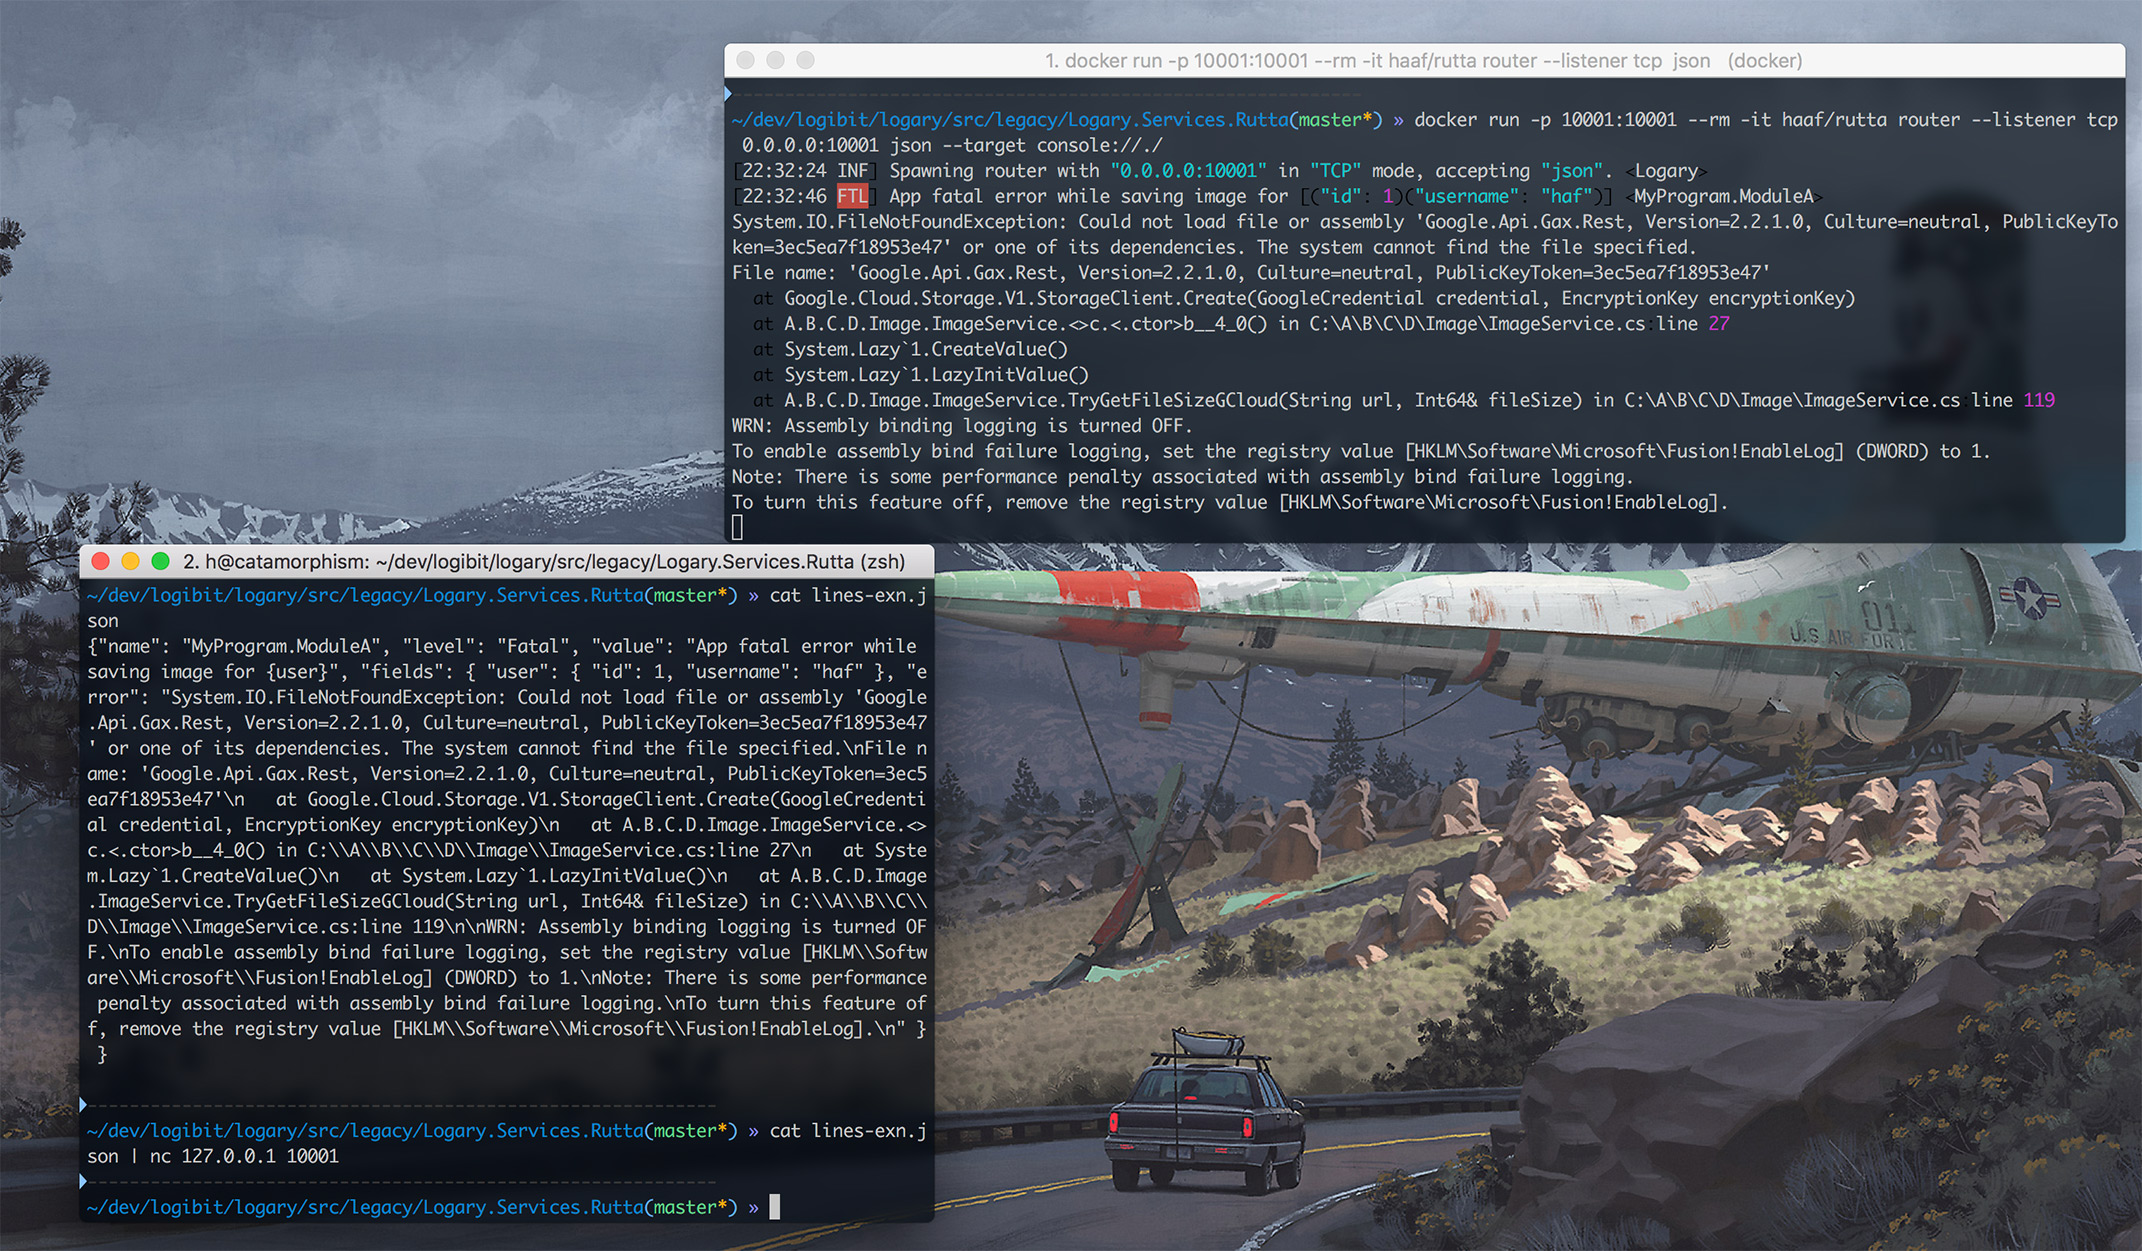
docker run -p 10001:10001 --rm -it haaf/rutta router --listener tcp 0.0.0.0:10001 json --target console://./

In depth
Rutta is software for shipping Messages between computers. Either from your own services or from Windows Performance Counters. This is useful if you want your services to ship all logs to a central point, before batching it and sending it off to InfluxDb. It's also useful if you want to firewall off a single subnet for certain processing and only have a single point ship logs and metrics.
- v1: Hard-coded supported target types. Initially we'll just support InfluxDB.
- v2: More configurable target configuration that supports any target.
This service can run in three modes; Shipper, Router and Proxy. Servers can be implemented using Hopac's lightweight servers. Communication is implemented using ZMQ and a binary serialisation format.
Bindings look may look like this:
- Shipper -> Router
- Shipper -> Proxy
- Proxy -> Proxy
- Proxy -> Router
On Windows you do ./rutta.exe -- --pub-to ... - note the two extra dashes before the parameter list. This is to avoid Topshelf munching the arguments away.
The Shipper – from environment to Proxy or Router
Enables log shipping from hosts that are not directly connected to the router nor to InfluxDB.
Pushing Shippers
Shippers CONNECT PUSH sockets to the Router's PULL socket. See http://lists.zeromq.org/pipermail/zeromq-dev/2012-February/015917.html
During network splits, the sending PUSH socket blocks.
Pushing Shippers
During network splits, the sending XPUSH socket drops messages.
The Proxy – from Shipper to Router
Proxies take inputs from Shippers or other Proxies that publish Messages using XPUB sockets:
The Proxy is run this way, by providing a XSUB socket binding and a XPUB socket binding:
During network splits, the receiving XSUB socket drops messages.
You can then connect to the Proxy with a Router that routes it to the final Target (like InfluxDB in this example):
During network splits, the sending XPUB socket drops messages.
The Router – from Shipper or Proxy to Target
Implements Fan-In using PULL or SUB of Messages from ZMQ. Forwards internally to a Target.
V1 only implements the InfluxDB target.
Pulling Routers
BINDs a PULL socket on a specified NIC/IP and PORT. Configures a single internal Target that pushes the received data.
During network splits, the listening PULL socket blocks.
Subscribing Routers
BINDs a SUB socket on a specified NIC/IP and POST. Configures a single internal Target that pushes the received data.
Serialisation for Rutta is done using FsPickler. Since FsPickler uses a binary format, it should be assumed to break for any given minor upgrade of FsPickler.
Each ZMQ message contains a Message (see DataModel.fs) in the binary form given by the serialiser chosen.
Logary Rutta Helm chart
The first step is to install the Rutta Helm chart into your Kubernetes cluster.
Rutta is a high-performance log router/shipper written in F# but configured from the command line. It's "cloud native" in that it runs as a docker container on top of .Net Core
Rutta is GPLv3 licensed (or alternatively commercially licensed). It's a packaging of Logary as a service, that you can run, either as a sidecar container or as a log router deployment.
Rutta is completely stateless, so you can run any number of replicas. It runs as a Kubernetes deployment with three replicas by default.
A common configuration for Rutta is to configure a Stackdriver target, a HTTP ingestion listener as well as a UDP ingestion listener. Your apps send UDP log messages to the UDP endpoint and your frontends (native apps and web sites) send HTTP messages to the HTTP endpoint. Rutta when batch-ships these log messages into Stackdriver.
By default this chart exposes a HTTP listener/endpoint and prints to console; in order for it to log to Stackdriver, AliYun or AppInsights, you have to configure those explicitly in the values file.
Have a look at the values.yaml file in order to get an idea of what you can configure.
Install the Helm chart
The first step is to install the Rutta Helm chart into your Kubernetes cluster.
helm install https://github.com/logary/logary/tree/master/src/services/rutta-helm-chart && \
    --name rutta && \
    --namespace monitoring
Or if you've downloaded the chart;
helm install ./rutta-helm-chart && \
    --name rutta && \
    --namespace monitoring
If you use a local values file, you can upgrade the chart.
helm upgrade --debug --install rutta && \
    ./rutta-helm-chart && \
    --namespace monitoring && \
    --values values/rutta.yaml
Rutta Router mode
The router mode lets you take inputs from a `listener` (tcp, udp, ...), interpret it with a `codec` and then send it to a `target`.
